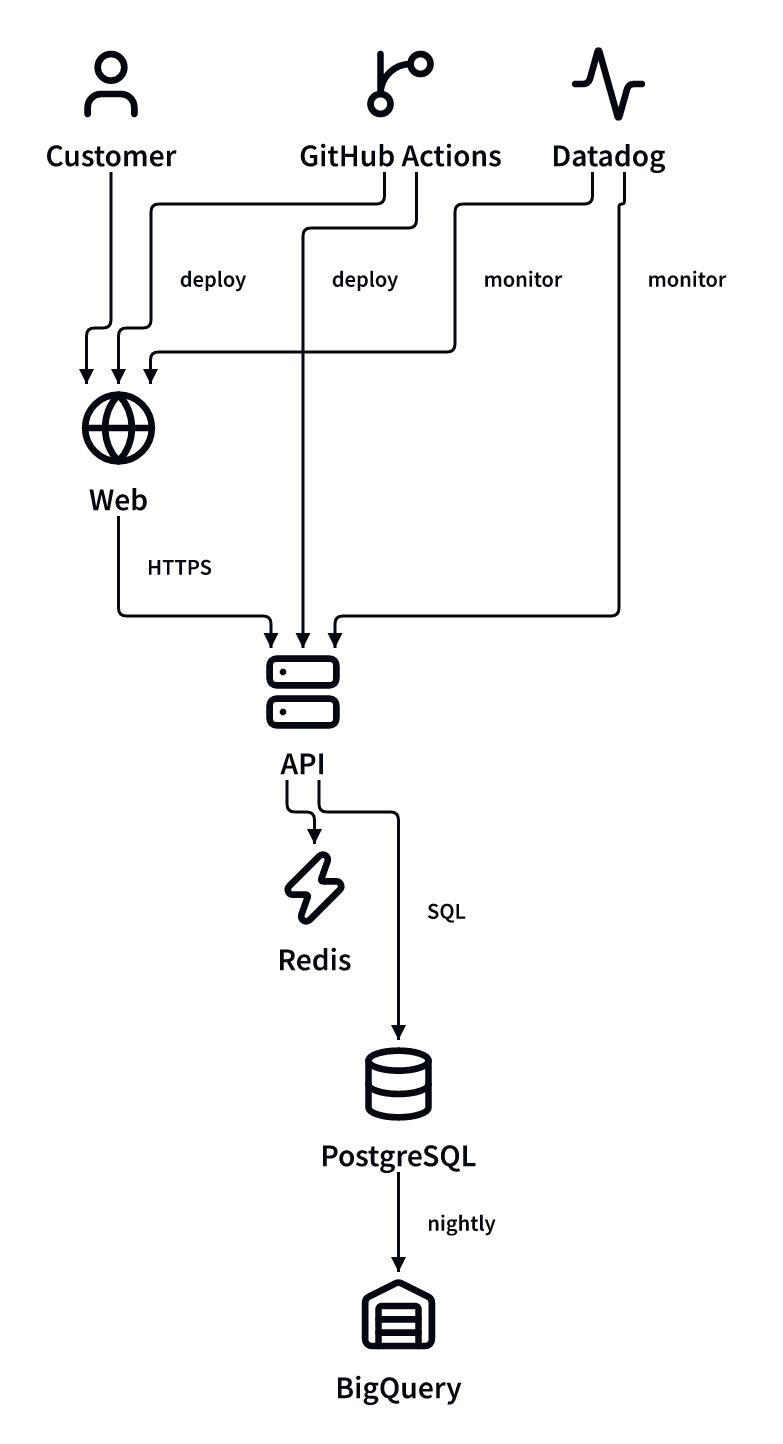
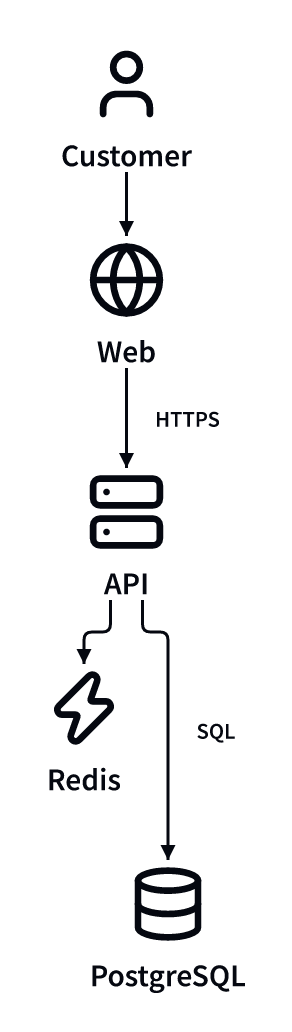
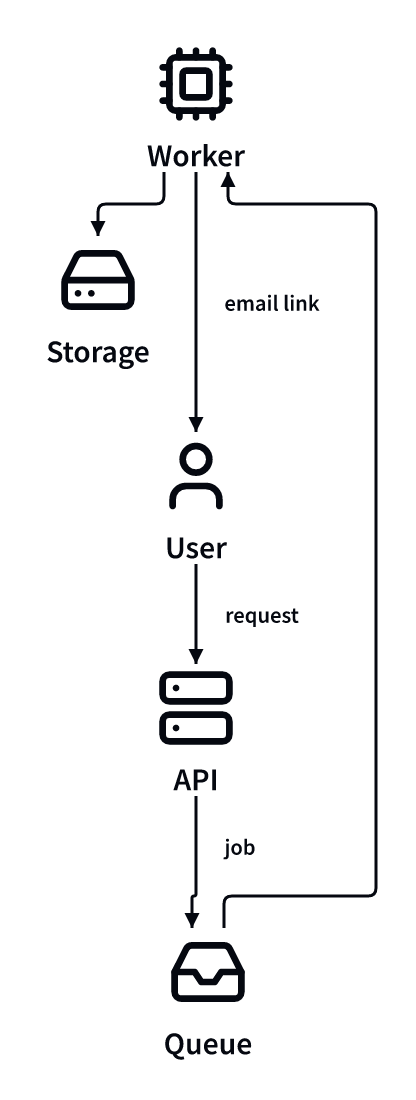
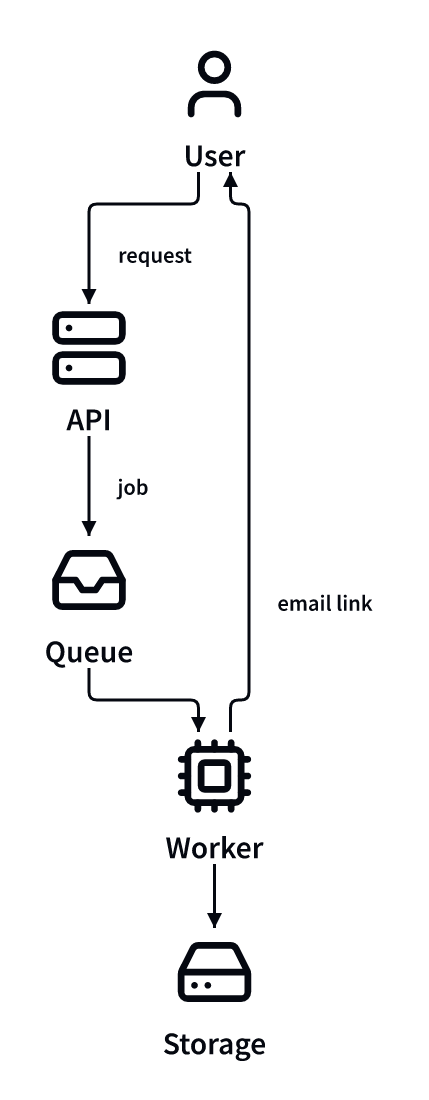
どの例も同じ内容を 2 回描いています。先の図は読みにくく、後の図は dia が AI に渡している描き方の指針(英語)に沿っています。画像はすべて、添えた JSON から dia 自身が描いたものです。同じ直し方を AI に頼むときの参考にしてください。
矢印で表す関係は 1 種類にする
呼び出し、デプロイ、監視、データの書き出しは、それぞれ別の種類の関係です。すべてを矢印で描くと矢印同士が交差し、お客さまがお店を使うときに何が起きるのかを読み取れなくなります。矢印にする関係は 1 種類に絞り、ほかは説明文に書きます。
- "description": "The online shop and everything around it.",
+ "description": "Arrows show calls made while a customer uses the shop.\n\nGitHub Actions deploys Web and API. Datadog monitors both. PostgreSQL is exported to BigQuery every night.",
  "model": {
    "edges": {
      "visit": { "from": "user", "to": "web" },
      "call": { "from": "web", "to": "api" },
      "query": { "from": "api", "to": "db" },
      "cached": { "from": "api", "to": "cache" },
-     "deployWeb": { "from": "ci", "to": "web" },
-     "deployApi": { "from": "ci", "to": "api" },
-     "watchWeb": { "from": "monitor", "to": "web" },
-     "watchApi": { "from": "monitor", "to": "api" },
-     "export": { "from": "db", "to": "warehouse" }
    }
  }
主な処理を先に書く
矢印が輪になるとき、dia は先に書かれた矢印の向きを保ち、後から書かれた矢印を戻りの矢印として描きます。戻りの矢印を先に書くと、話の終わりから図が始まります。直す前の図では Worker がいちばん上に来て、利用者の依頼が途中から下へ伸びています。
  "edges": {
-   "notify": { "from": "worker", "to": "user" },
    "request": { "from": "user", "to": "api" },
    "enqueue": { "from": "api", "to": "queue" },
    "pick": { "from": "queue", "to": "worker" },
    "store": { "from": "worker", "to": "bucket" },
+   "notify": { "from": "worker", "to": "user" }
  }
配置の向きを決め、残りの並び方を読む
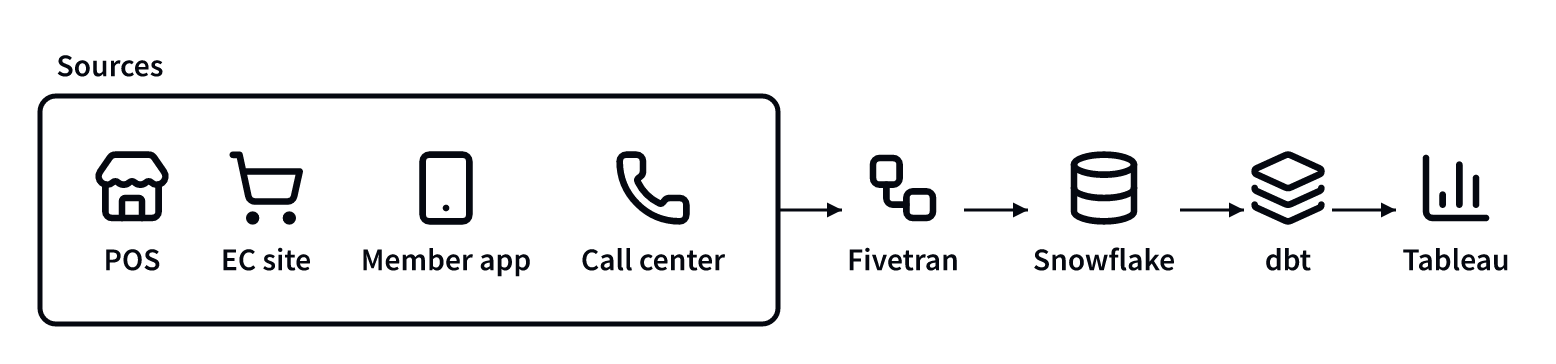
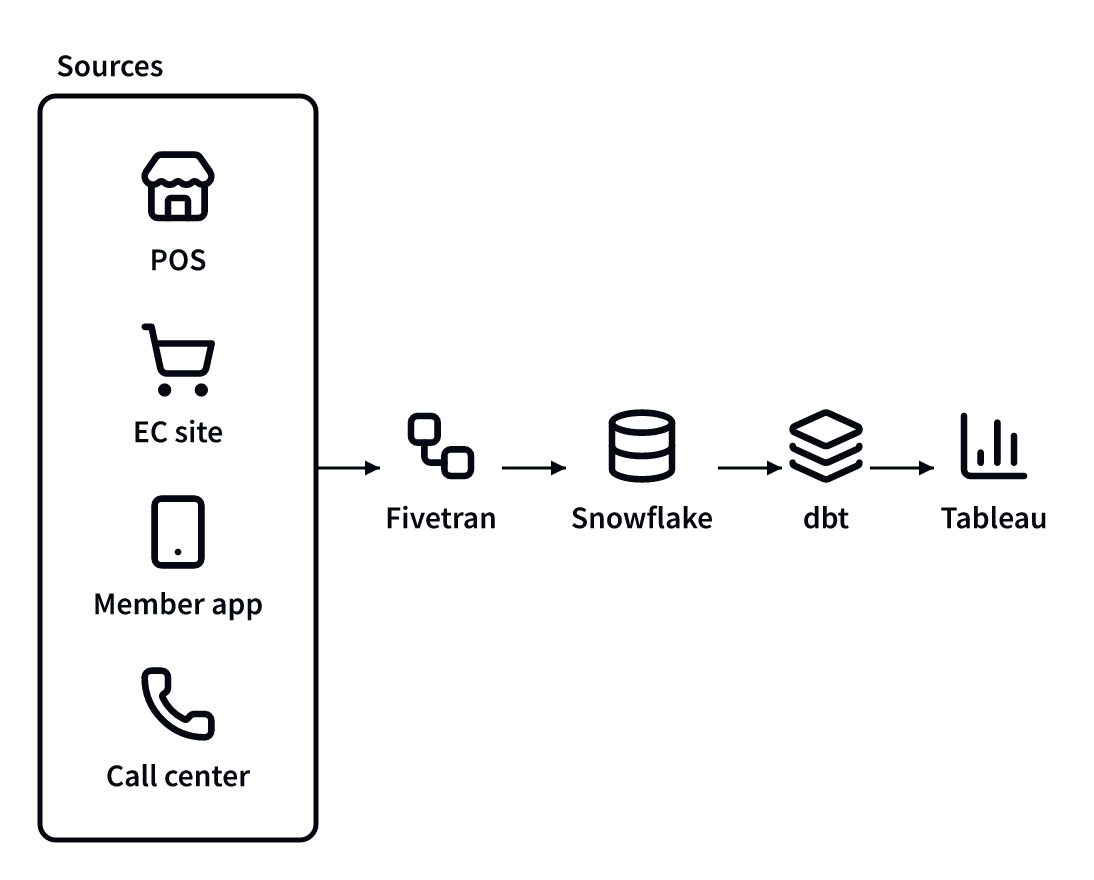
flow は配置の向きを決めます。"down" は矢印の元を上に、"right" は左に置きます。矢印でつながっていない要素は、配置の向きと直角に並びます。"down" では横に、"right" では縦に並びます。そのため、グループの中身を縦に積みたいときは、そのグループを "down" ではなく "flow": "right" にします。この例では処理が左から右へ流れ、4 つのデータ元が始まりにリストとして並びます。
  "style": {
    "root": { "flow": "right" },
-   "sources": { "label": "Sources", "flow": "down" },
+   "sources": { "label": "Sources", "flow": "right" },
ラベルは短くする
ラベルは 1 行で描かれるため、長いラベルは図の幅を広げます。矢印のラベルは 1 つごとに 1 行分の間隔を取ります。要素の名前は数語にとどめ、バージョン、台数、設定値は説明文に移します。説明文には Markdown が使えます。
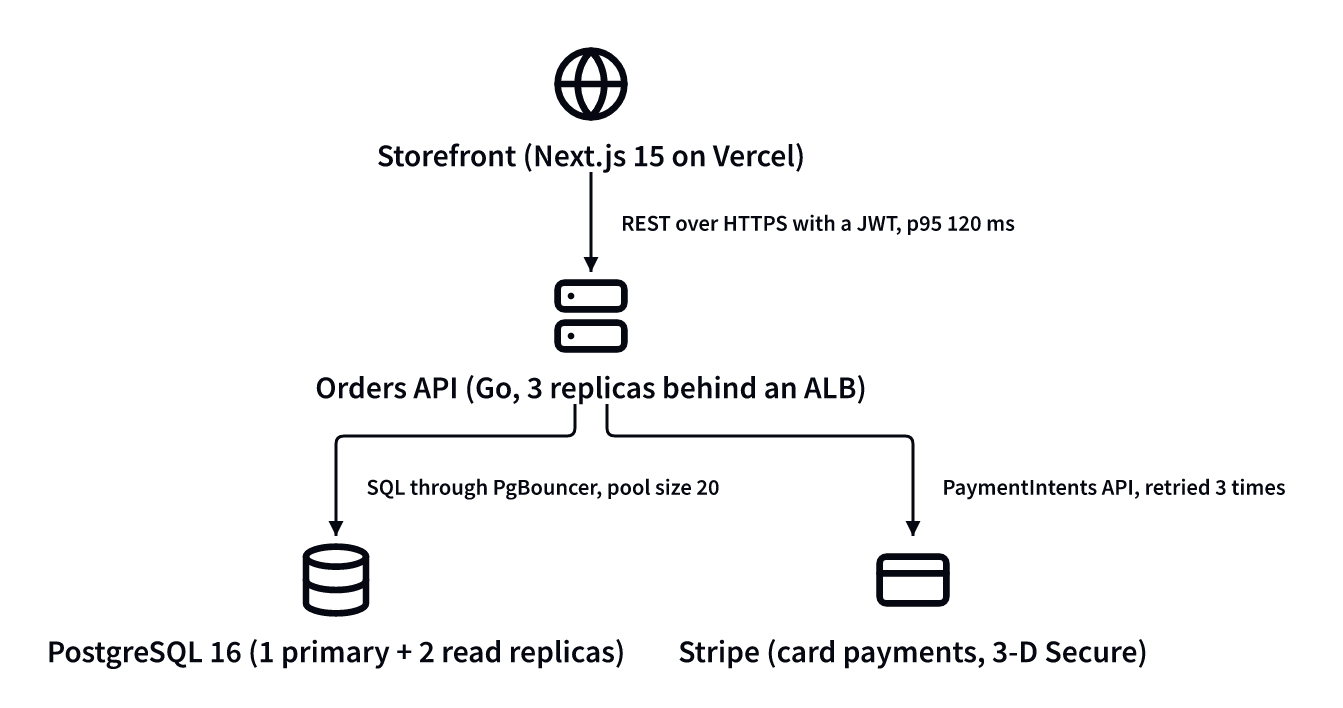
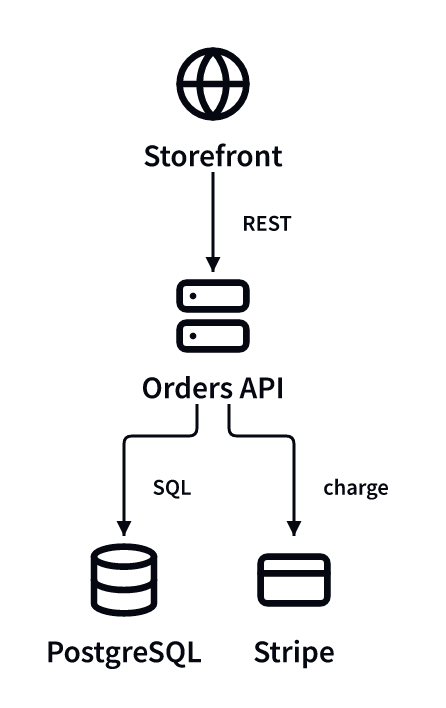
- "web": { "label": "Storefront (Next.js 15 on Vercel)", "icon": "i:lucide:globe" },
- "api": { "label": "Orders API (Go, 3 replicas behind an ALB)", "icon": "i:lucide:server" },
- "call": { "label": "REST over HTTPS with a JWT, p95 120 ms" },
+ "web": { "label": "Storefront", "icon": "i:lucide:globe" },
+ "api": { "label": "Orders API", "icon": "i:lucide:server" },
+ "call": { "label": "REST" },
詳しいことは説明文に書きます。
How an order is placed.

- Storefront: Next.js 15 on Vercel. Calls the Orders API over HTTPS with a JWT (p95 120 ms).
- Orders API: Go, 3 replicas behind an ALB.
- PostgreSQL 16: 1 primary and 2 read replicas, reached through PgBouncer (pool size 20).
- Stripe: card payments with 3-D Secure through the PaymentIntents API, retried 3 times.
大きなシステムは分けて描く
1 枚の図が答える問いは 1 つにします。サービス、データベース、ワーカーをすべて 1 枚に描くと、どの処理も目立ちません。1 つのドキュメントに複数の図を入れ、まず領域を示す全体図、続いて領域や処理ごとの図を置きます。
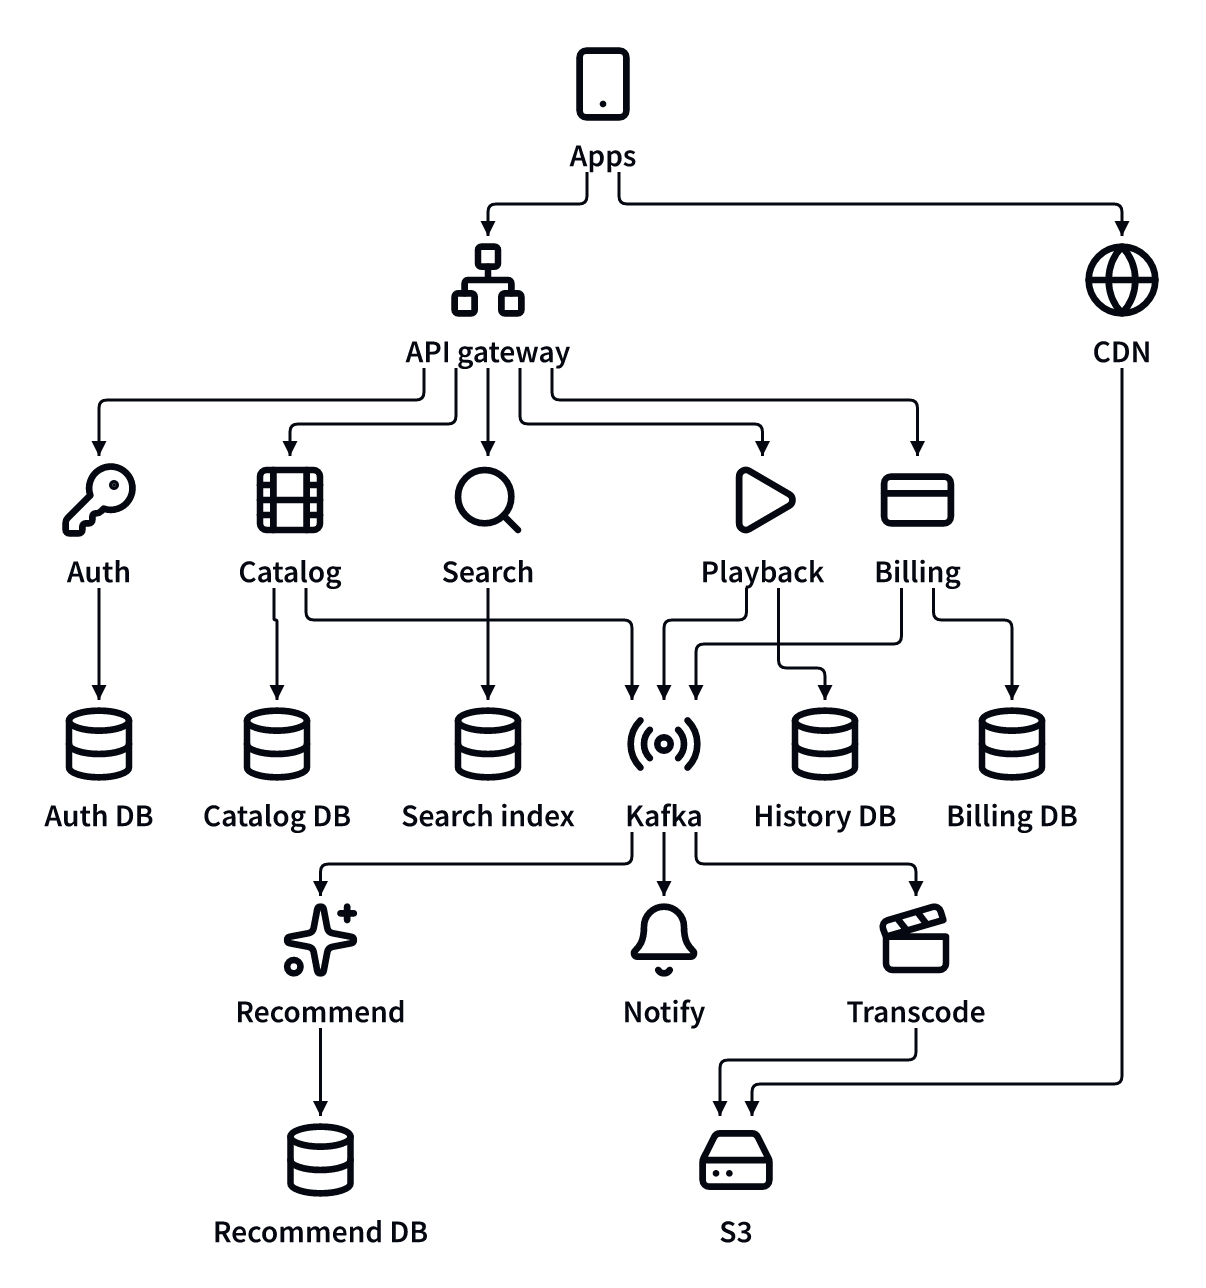
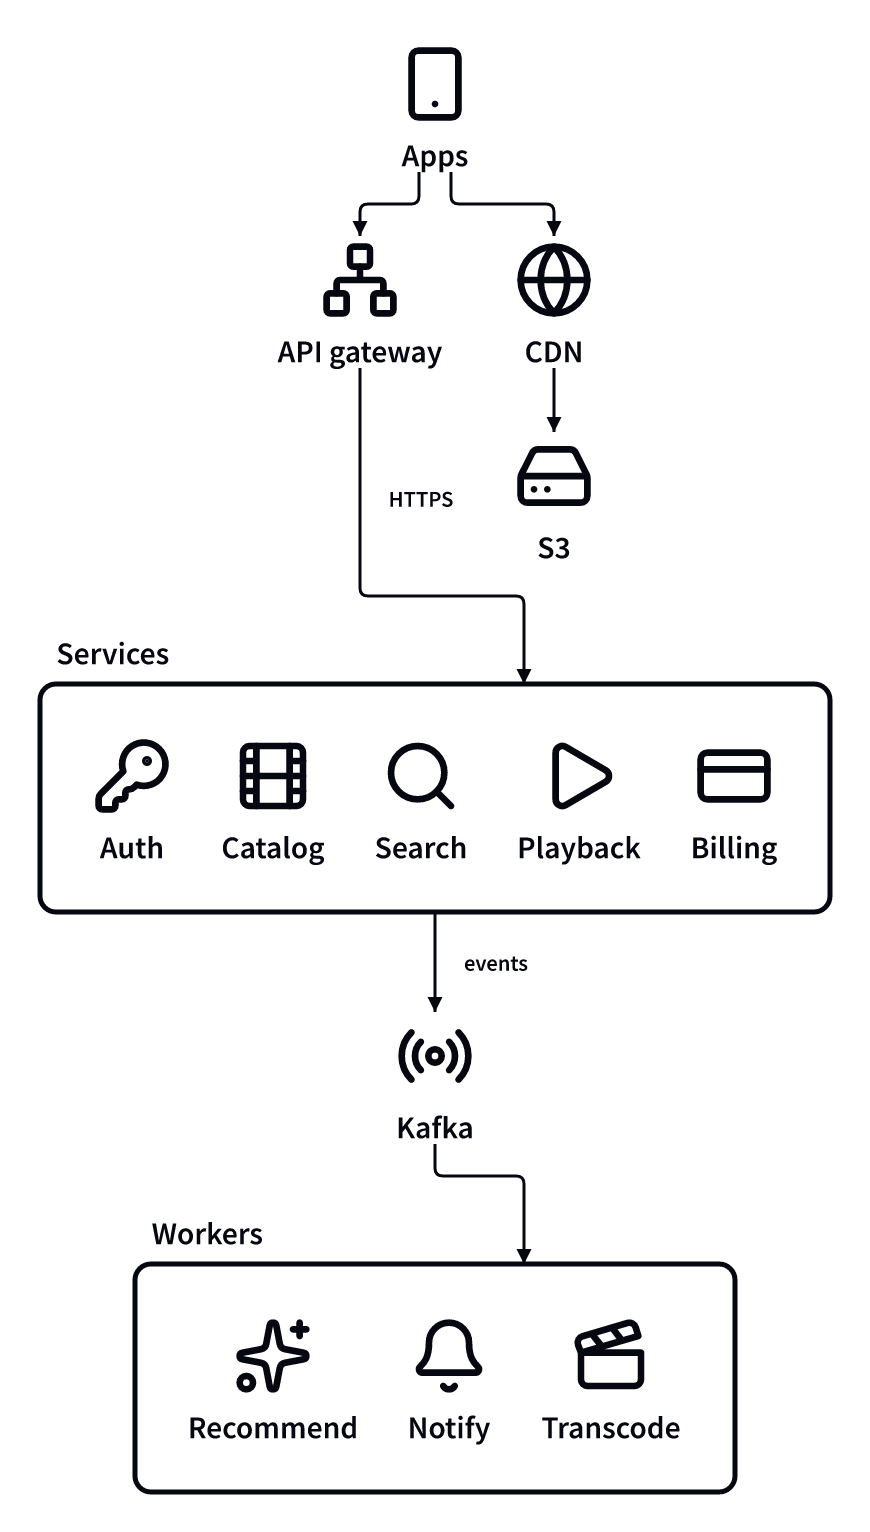
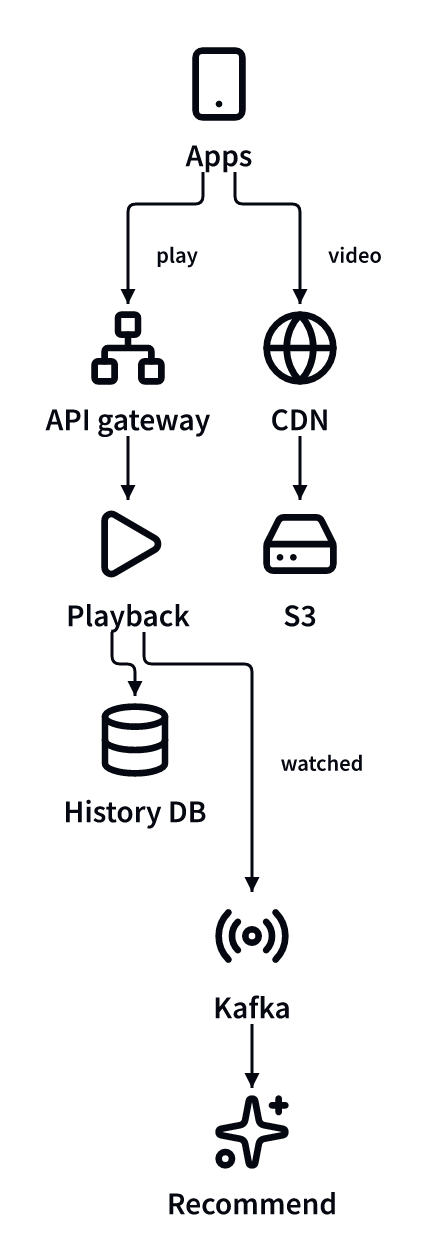
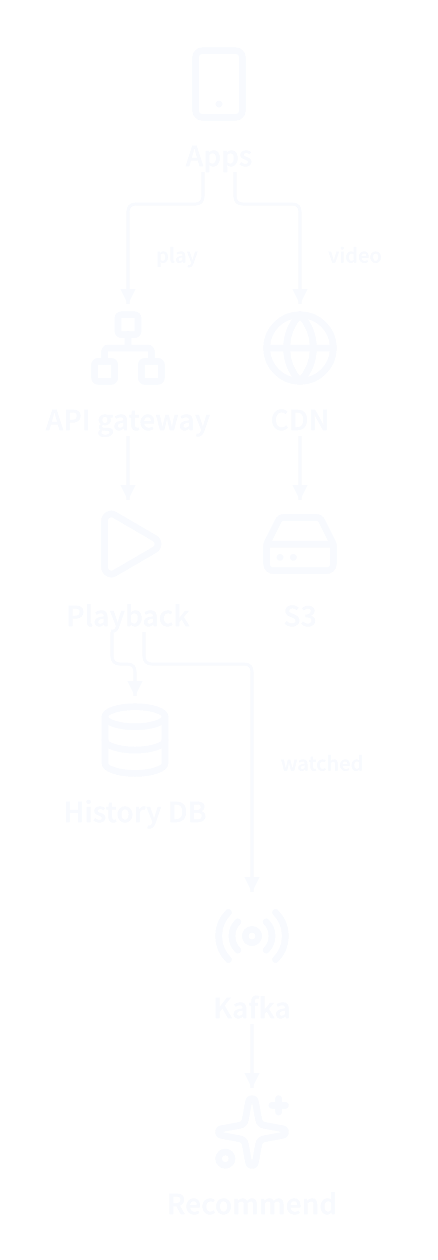
全体図では、サービスをグループにまとめ、領域ごとに矢印を 1 本だけ引きます。
"edges": {
  "hasAuth": { "from": "services", "to": "auth", "type": "contains" },
  "hasPlayback": { "from": "services", "to": "playback", "type": "contains" },
  "api": { "from": "apps", "to": "gateway" },
  "route": { "from": "gateway", "to": "services" },
  "publish": { "from": "services", "to": "kafka" },
  "consume": { "from": "kafka", "to": "workers" }
}
1 枚のまま残したいときは、ビューを足します。dia でビューを選ぶと、挙げた要素と矢印が強調され、ほかは薄く表示されます。
"views": {
  "playback": {
    "title": "Playback",
    "ids": ["api", "toPlayback", "playbackData", "playbackEvents", "toRecommend", "watch", "origin"]
  }
}
変化はステップで見せる
今のやり方と移行後のやり方を比べるときは、両方を 1 枚に描かないでください。共通する要素が 2 回ずつ現れ、左右の配置もばらばらに決まります。代わりに "kind": "steps" のドキュメントを作ります。各図は前の図の写しから始まり、残った要素は同じ位置に描かれるので、変わったところだけが目に入ります。要素を少しずつ増やしながら説明する図にも、同じ形式が向いています。
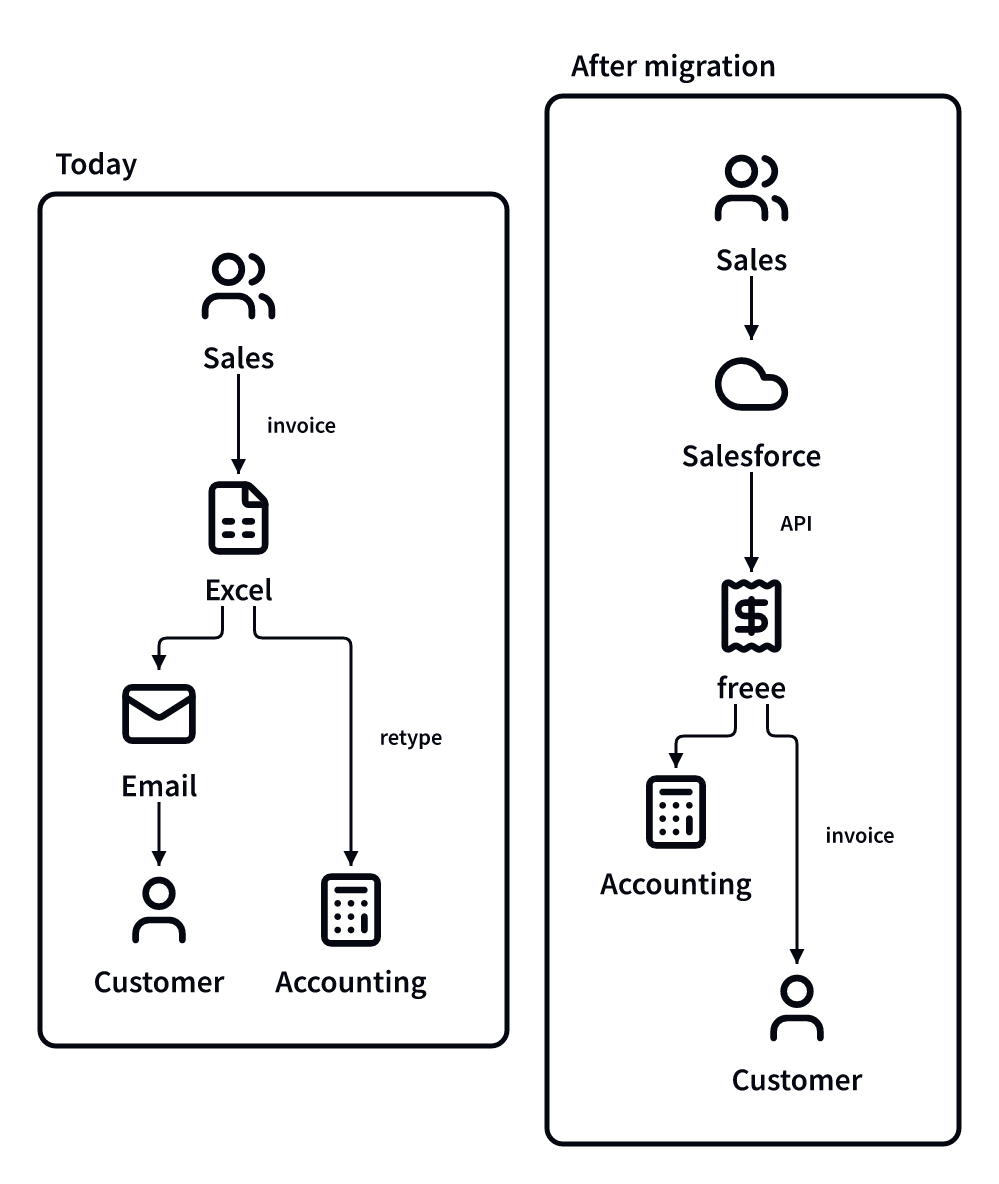
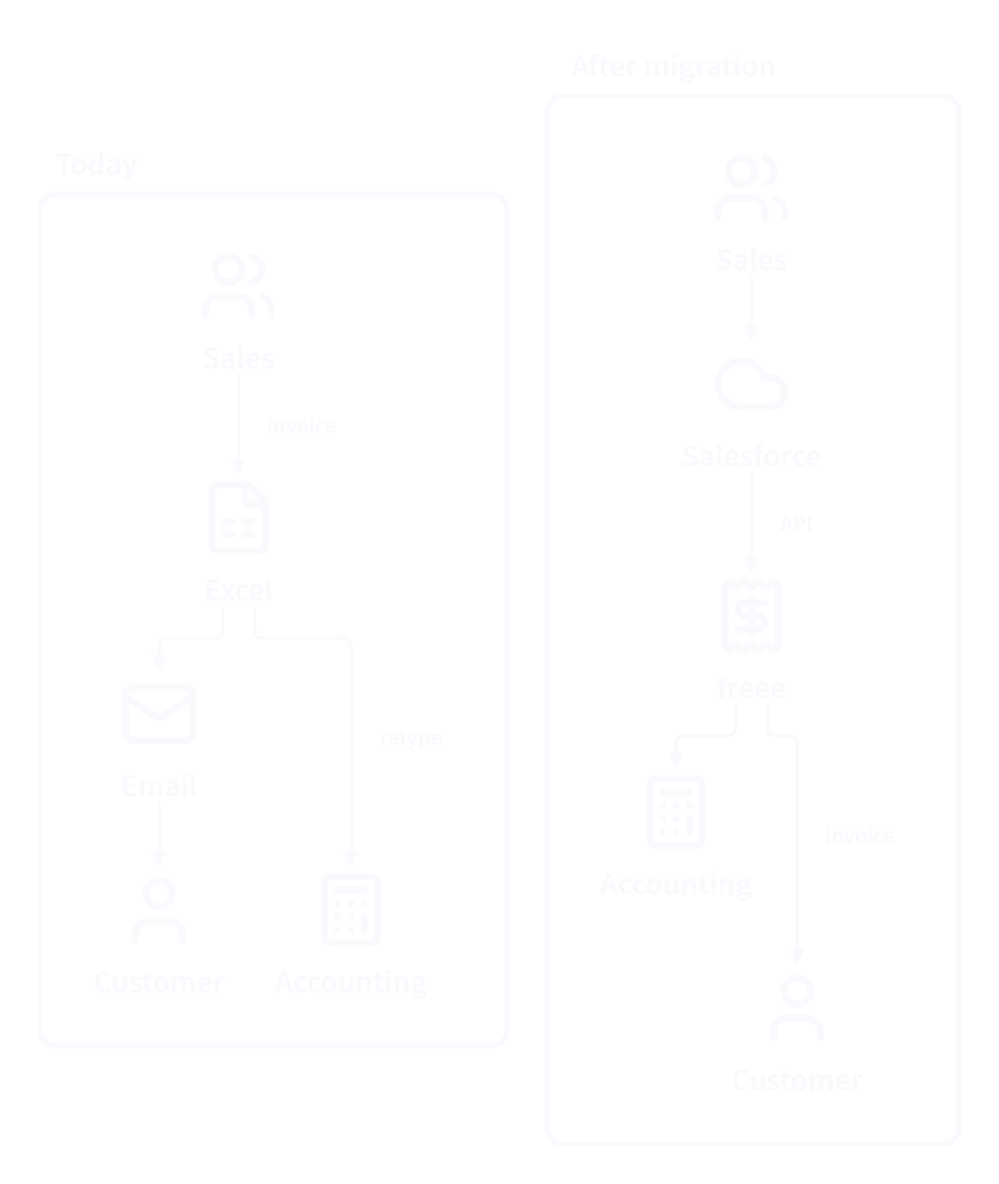
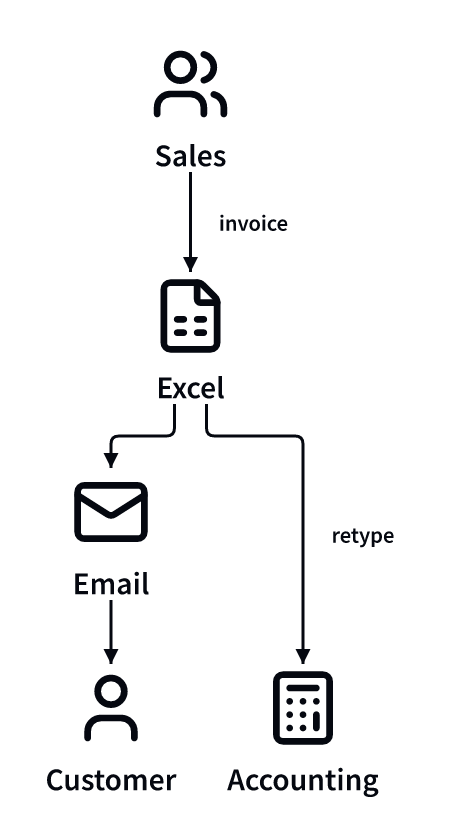
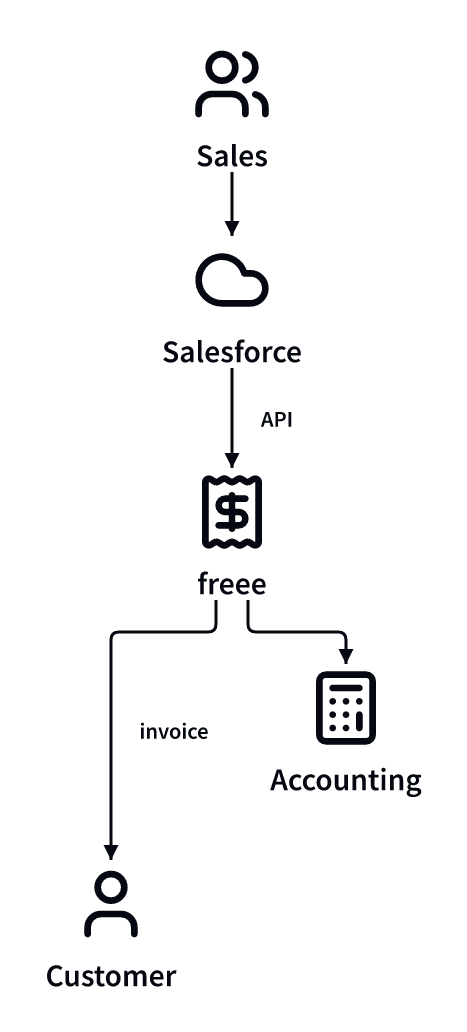
- create_document { "kind": "standard" }   "today" と "later" のグループを持つ図が 1 枚
+ create_document { "kind": "steps" }      図 "today" の次に図 "migrated"
2 つ目のステップでは sales、customer、accounting の ID をそのまま使い、間の矢印だけを入れ替えます。
"edges": {
  "close": { "from": "sales", "to": "salesforce" },
  "sync": { "from": "salesforce", "to": "freee" },
  "invoice": { "from": "freee", "to": "customer" },
  "book": { "from": "freee", "to": "accounting" }
}