Each pair draws the same subject twice. The first version reads poorly; the second follows the guidance dia gives to AI assistants. dia drew every image here from the diagram JSON shown, so you can ask your AI for the same fixes.
Draw one kind of relation
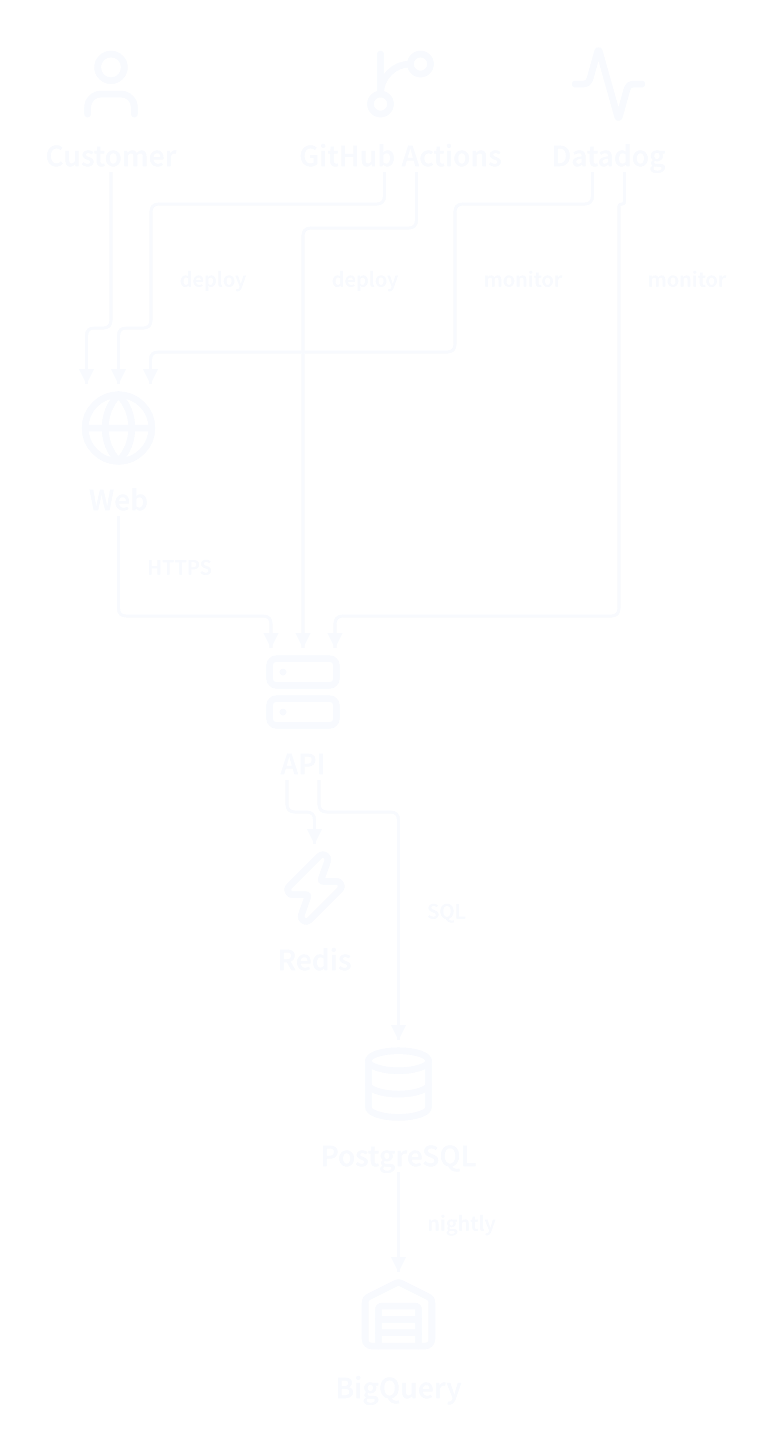
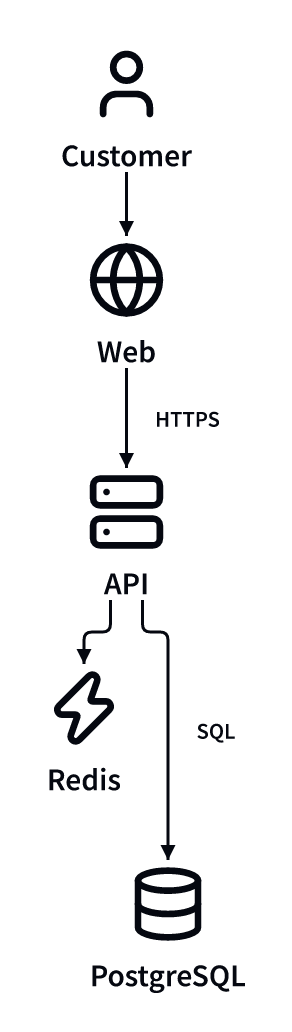
Calls, deployments, monitoring, and data exports are different kinds of relations. Drawn together as arrows, they cross each other, and a reader can’t tell which arrows show what happens when a customer uses the shop. Keep one kind as arrows and state the others in the description.
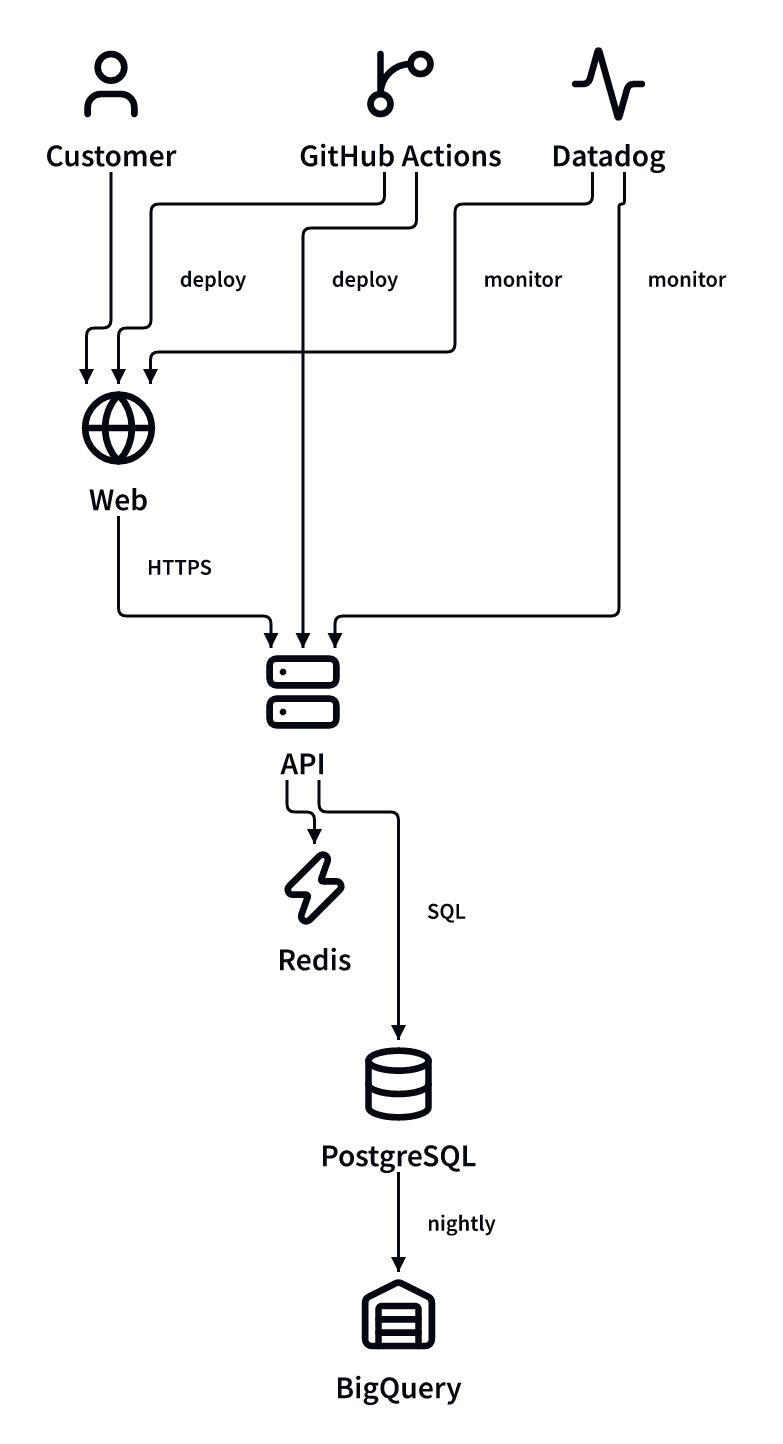
- "description": "The online shop and everything around it.",
+ "description": "Arrows show calls made while a customer uses the shop.\n\nGitHub Actions deploys Web and API. Datadog monitors both. PostgreSQL is exported to BigQuery every night.",
  "model": {
    "edges": {
      "visit": { "from": "user", "to": "web" },
      "call": { "from": "web", "to": "api" },
      "query": { "from": "api", "to": "db" },
      "cached": { "from": "api", "to": "cache" },
-     "deployWeb": { "from": "ci", "to": "web" },
-     "deployApi": { "from": "ci", "to": "api" },
-     "watchWeb": { "from": "monitor", "to": "web" },
-     "watchApi": { "from": "monitor", "to": "api" },
-     "export": { "from": "db", "to": "warehouse" }
    }
  }
Write the main flow first
When arrows form a loop, dia keeps the direction of the arrows written first and draws the later ones as returns. If the return arrow comes first, the diagram starts from the end of the story: here the worker sits on top and the user’s request points down from the middle.
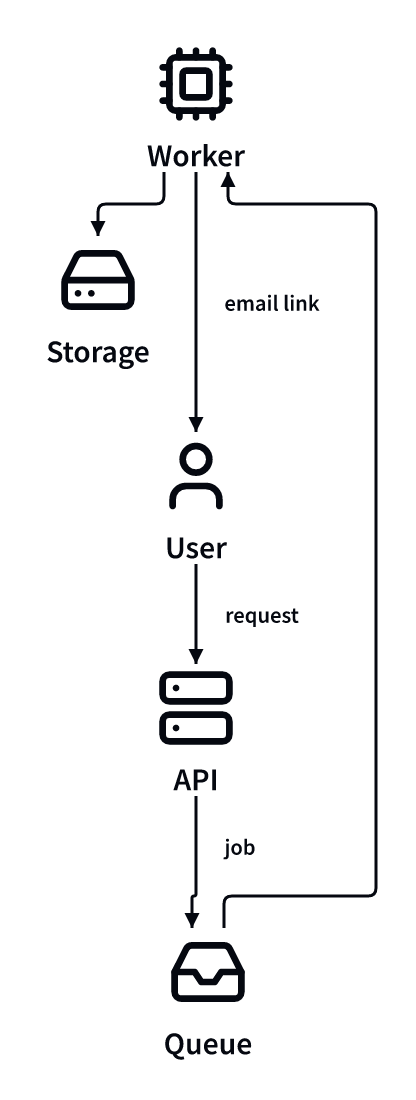
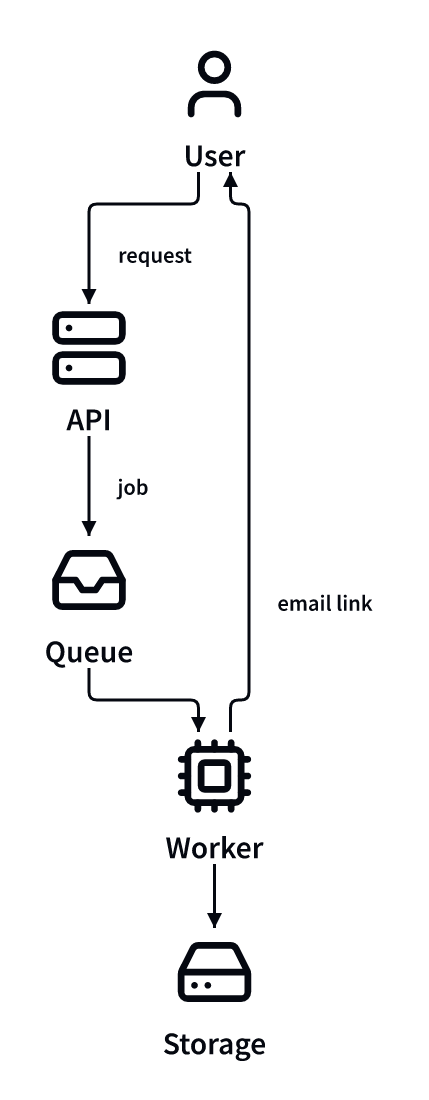
  "edges": {
-   "notify": { "from": "worker", "to": "user" },
    "request": { "from": "user", "to": "api" },
    "enqueue": { "from": "api", "to": "queue" },
    "pick": { "from": "queue", "to": "worker" },
    "store": { "from": "worker", "to": "bucket" },
+   "notify": { "from": "worker", "to": "user" }
  }
Choose the flow, then line up the rest
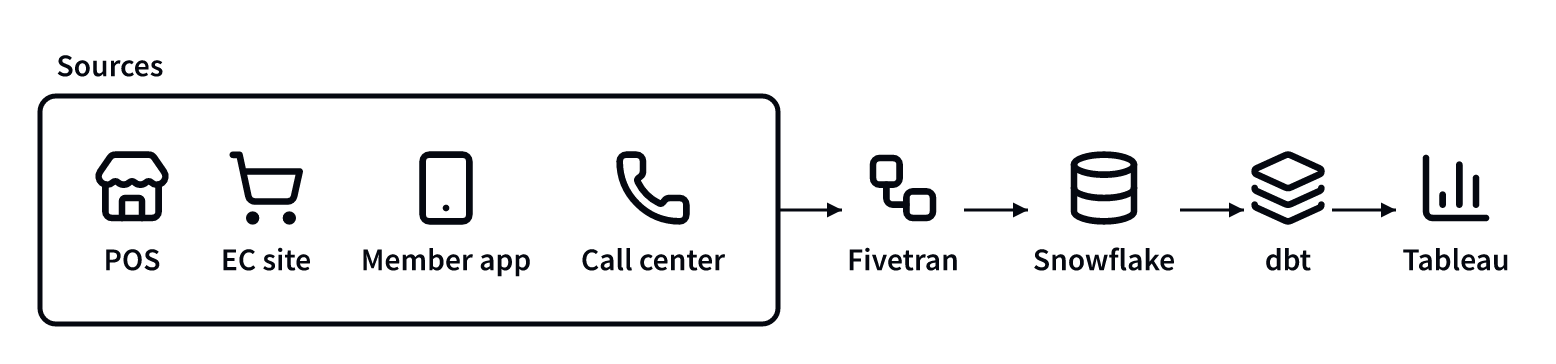
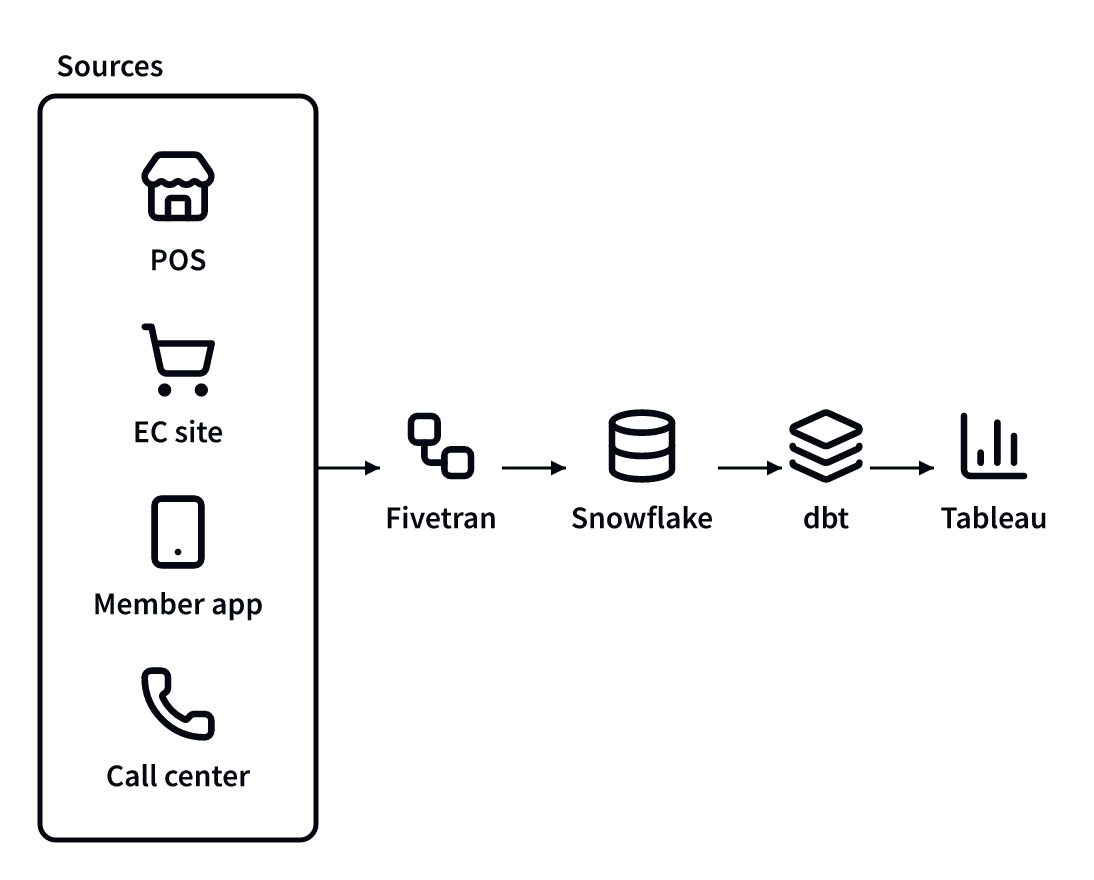
flow decides where arrows point: "down" puts sources above targets, "right" puts them to the left. Elements with no arrow between them line up across the flow: side by side in "down", stacked in "right". So to stack a container’s children, give the container "flow": "right", not "down". Here the pipeline reads left to right, and the four sources form a list at its start.
  "style": {
    "root": { "flow": "right" },
-   "sources": { "label": "Sources", "flow": "down" },
+   "sources": { "label": "Sources", "flow": "right" },
Keep labels short
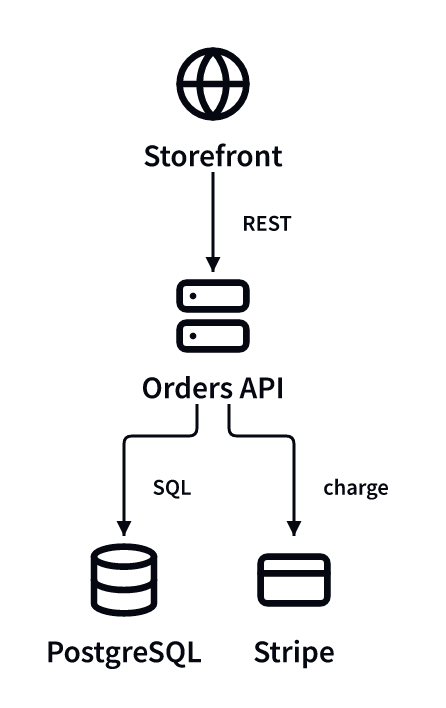
Labels stay on one line, so long labels widen the diagram, and each edge label adds a row of space. Name each element in a few words and move versions, counts, and settings into the description, which supports Markdown.
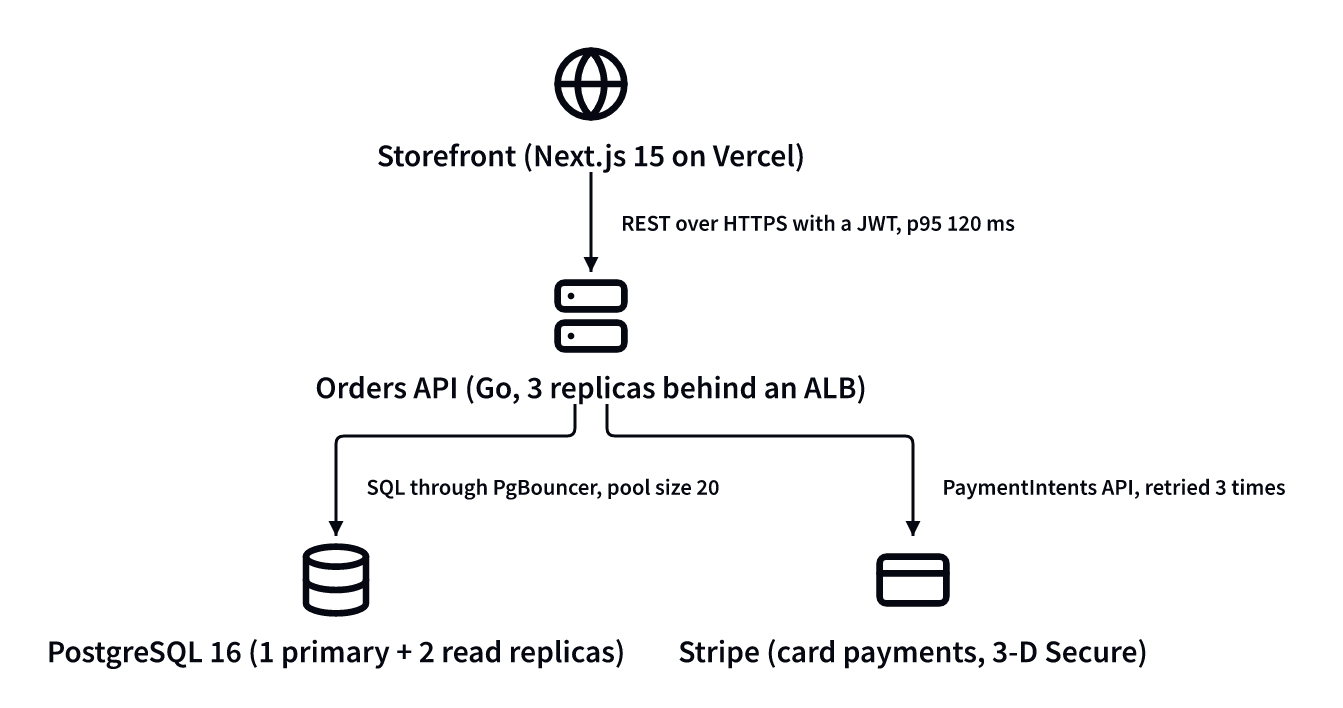
- "web": { "label": "Storefront (Next.js 15 on Vercel)", "icon": "i:lucide:globe" },
- "api": { "label": "Orders API (Go, 3 replicas behind an ALB)", "icon": "i:lucide:server" },
- "call": { "label": "REST over HTTPS with a JWT, p95 120 ms" },
+ "web": { "label": "Storefront", "icon": "i:lucide:globe" },
+ "api": { "label": "Orders API", "icon": "i:lucide:server" },
+ "call": { "label": "REST" },
The details go into the description:
How an order is placed.

- Storefront: Next.js 15 on Vercel. Calls the Orders API over HTTPS with a JWT (p95 120 ms).
- Orders API: Go, 3 replicas behind an ALB.
- PostgreSQL 16: 1 primary and 2 read replicas, reached through PgBouncer (pool size 20).
- Stripe: card payments with 3-D Secure through the PaymentIntents API, retried 3 times.
Split a large system
A diagram should answer one question. With every service, database, and worker in one picture, no single flow stands out. Put several diagrams in one document instead: an overview that shows the areas, then one diagram per area or flow.
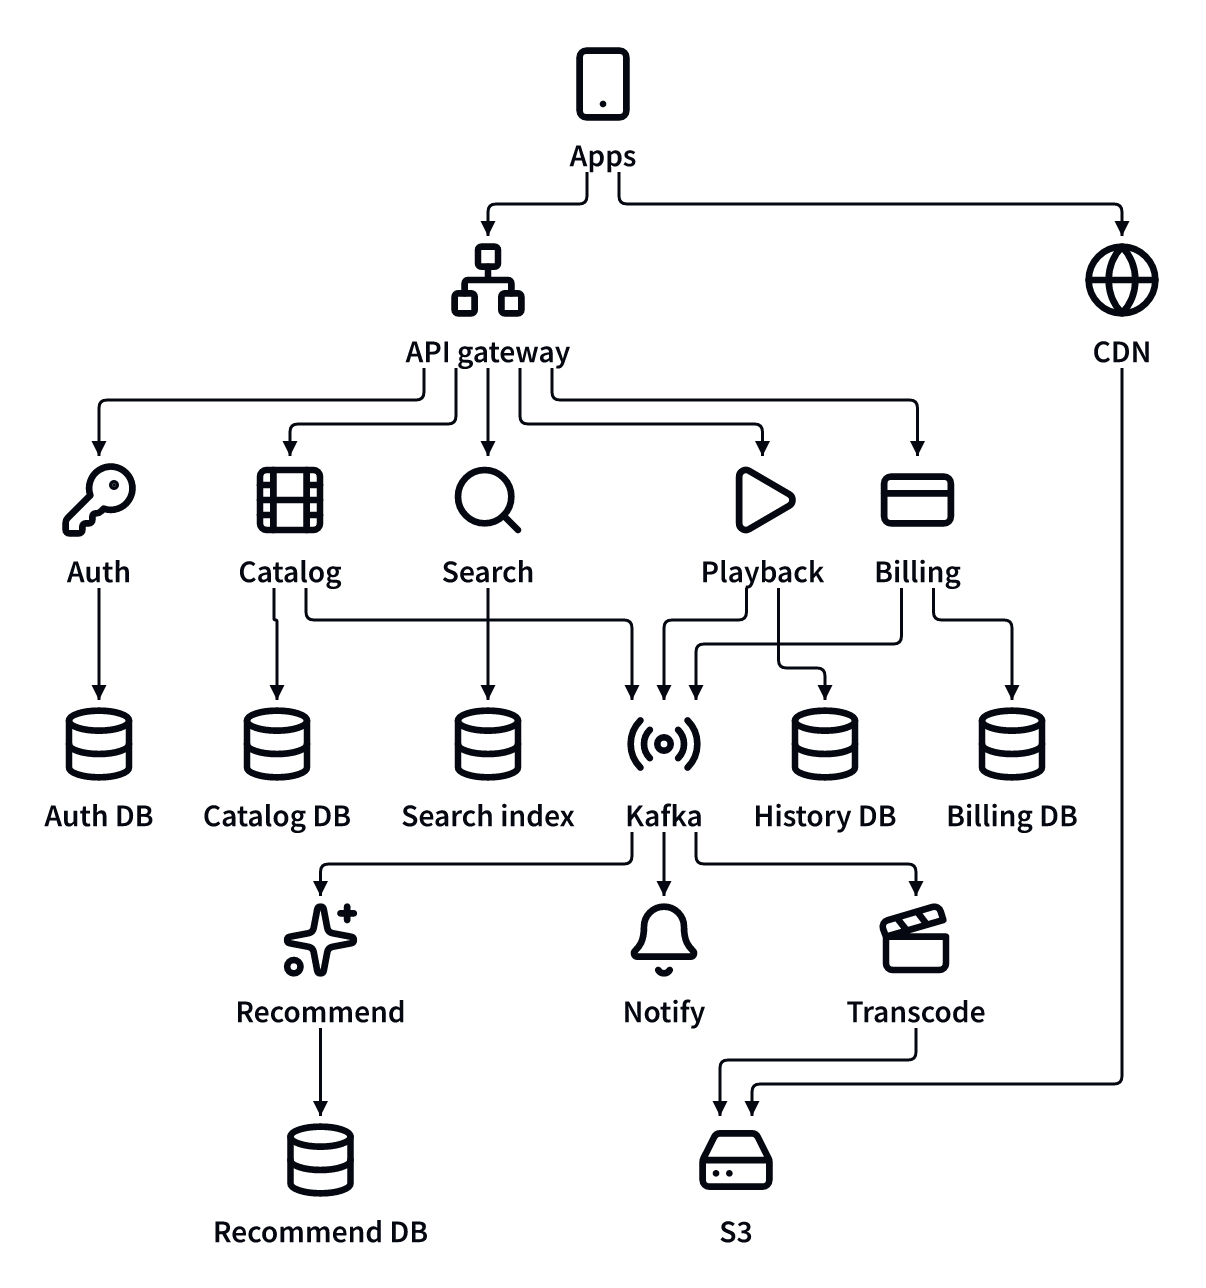
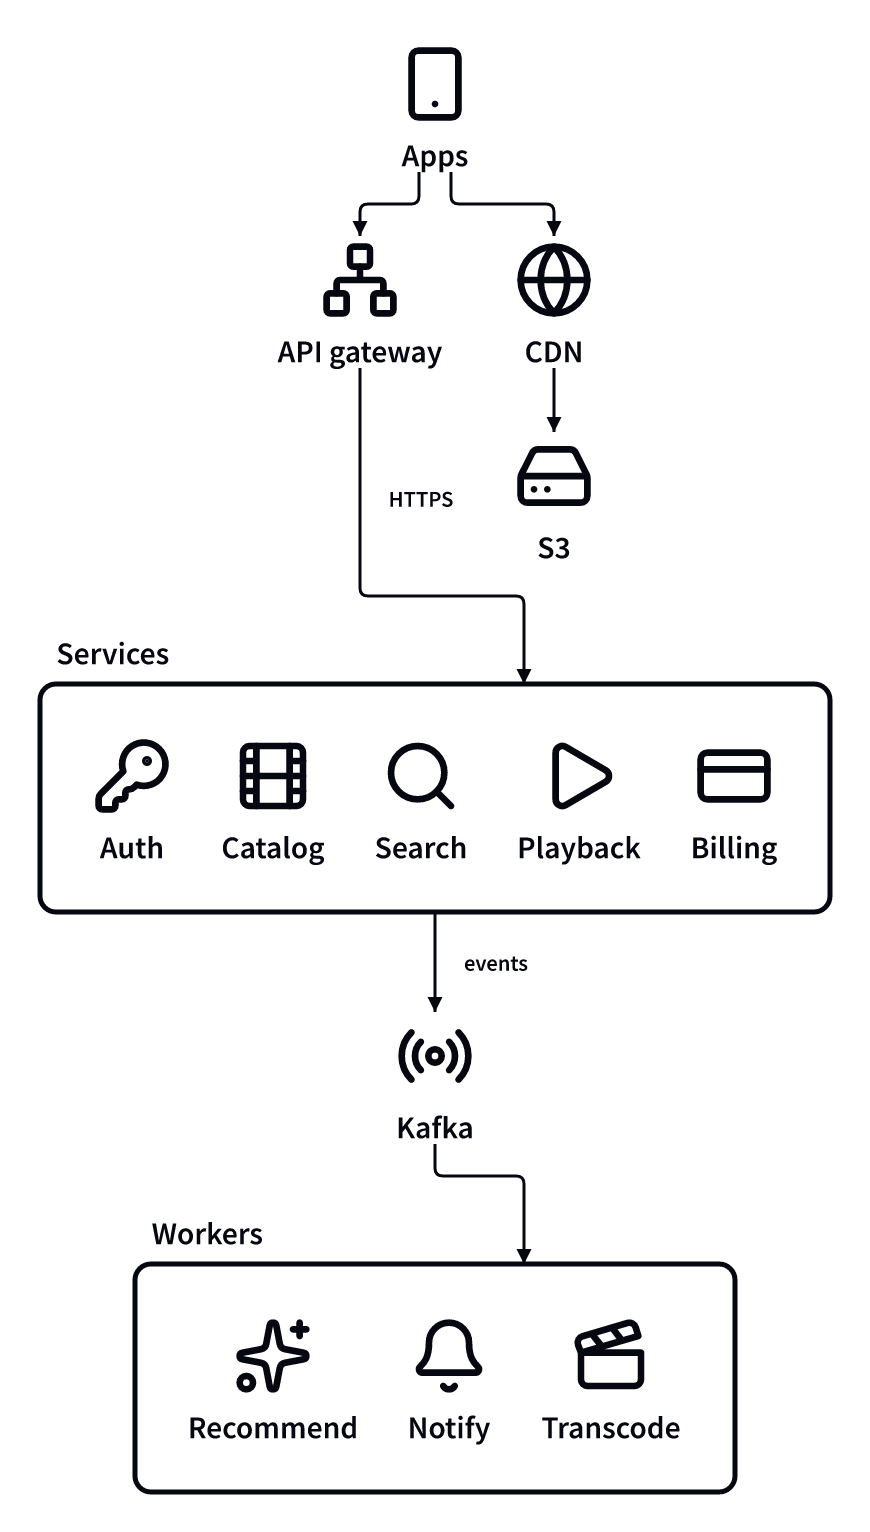
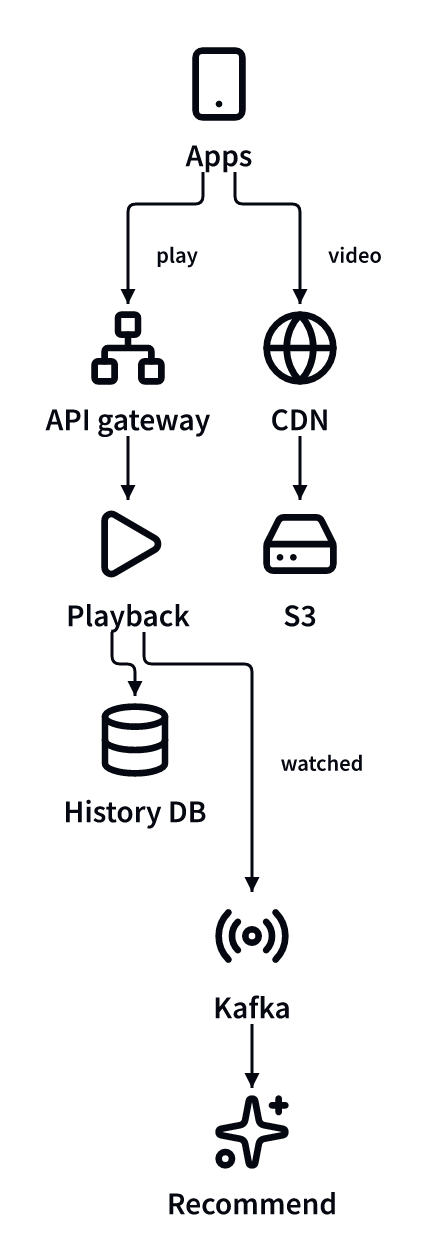
The overview groups the services in a container and draws one arrow per area:
"edges": {
  "hasAuth": { "from": "services", "to": "auth", "type": "contains" },
  "hasPlayback": { "from": "services", "to": "playback", "type": "contains" },
  "api": { "from": "apps", "to": "gateway" },
  "route": { "from": "gateway", "to": "services" },
  "publish": { "from": "services", "to": "kafka" },
  "consume": { "from": "kafka", "to": "workers" }
}
To keep a single diagram instead, add views. A view highlights the listed nodes and edges and dims the rest when a reader picks it in dia:
"views": {
  "playback": {
    "title": "Playback",
    "ids": ["api", "toPlayback", "playbackData", "playbackEvents", "toRecommend", "watch", "origin"]
  }
}
Show changes as steps
To compare how things work today with how they will work, don’t draw both in one diagram. Every shared element then appears twice, and the two halves are laid out independently. Create a document with "kind": "steps" instead. Each diagram starts as a copy of the previous one, and elements that stay keep their place, so the reader sees only what changed. The same kind suits a picture that builds up one piece at a time.
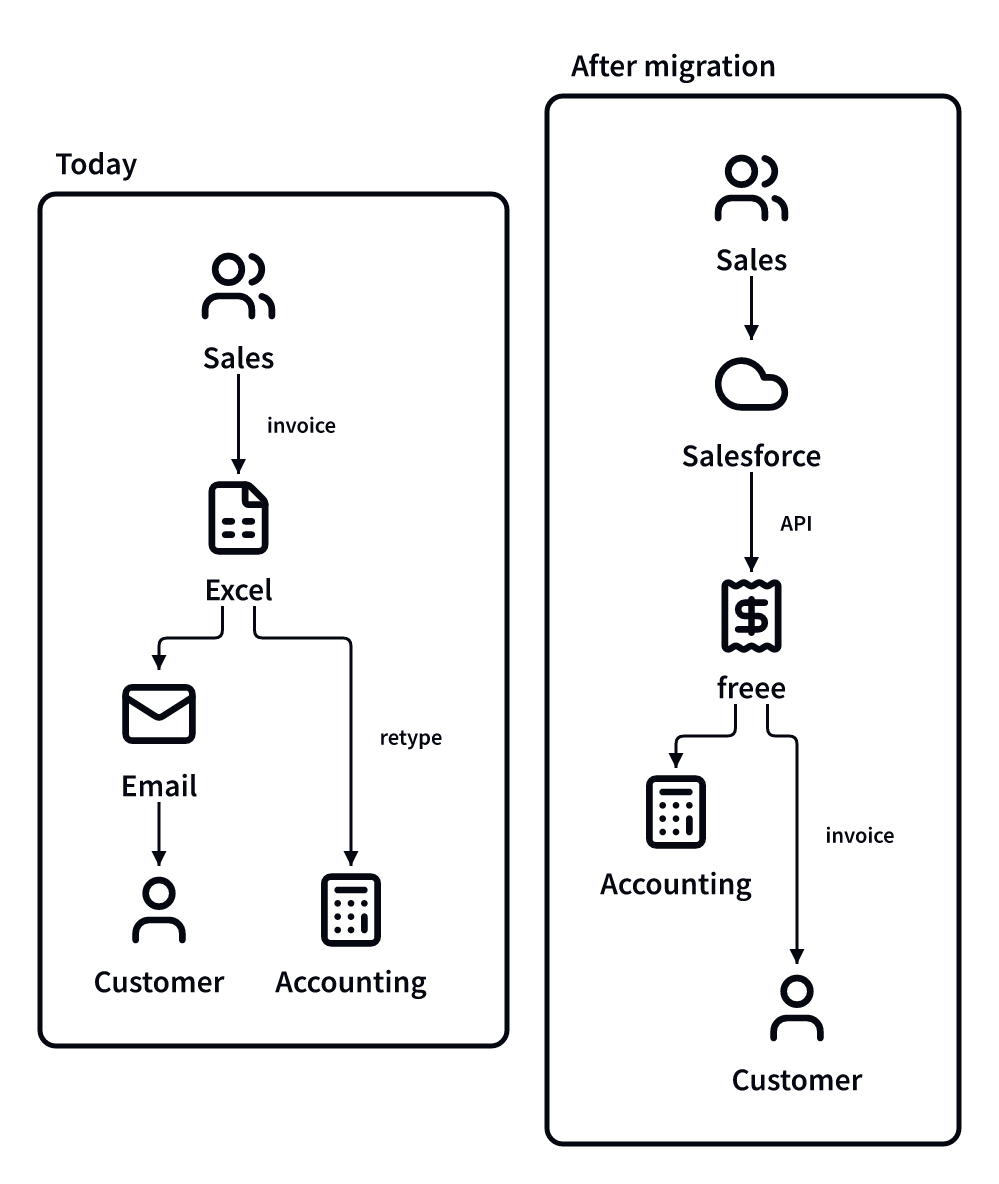
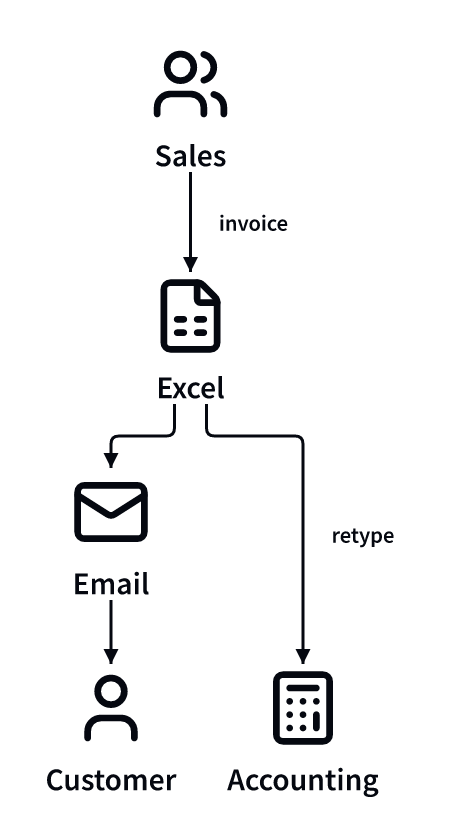
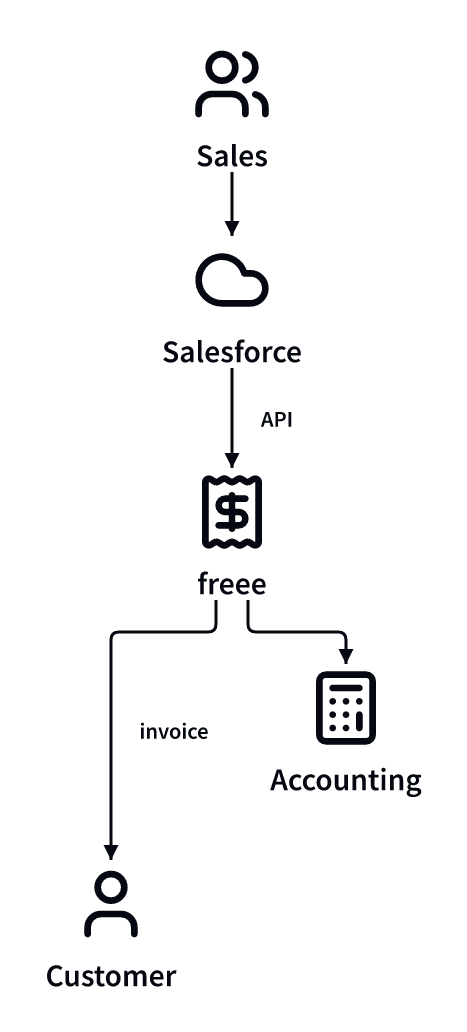
- create_document { "kind": "standard" }   one diagram with "today" and "later" containers
+ create_document { "kind": "steps" }      diagram "today", then diagram "migrated"
The second step keeps the ids sales, customer, and accounting, and replaces only the edges in between:
"edges": {
  "close": { "from": "sales", "to": "salesforce" },
  "sync": { "from": "salesforce", "to": "freee" },
  "invoice": { "from": "freee", "to": "customer" },
  "book": { "from": "freee", "to": "accounting" }
}